Who I Am
I moved to the US in 2018. New York City hit me like nothing else. I was doing my PhD in Experimental Quantum Physics at NYU when I stumbled into trading, and honestly, that changed the whole trajectory for me.
It started as a side thing during grad school. I got into futures in 2021, discovered prop firms, and got hooked. The last five years have been a grind. Lots of losses, lots of lessons, and slowly getting better at this.
Now I split my time between quantum tech and trading futures. Two completely different worlds, but both come down to the same thing: stay disciplined, think in probabilities, and be patient.
New York University, 2023
2023 – 2026
Current
Since 2021
The Journey
Trading is harder than quantum physics. Not because of the charts or the technicals, but because of what goes on in your head. Five years in, I've learned more about myself than any physics experiment ever taught me. Here's what I know to be true:
I've been through the eval addiction trap. I've blown accounts. I've revenge traded. I've sat there staring at the screen wondering if I'd ever figure this out. But I kept going. Not because I'm special, but because I was willing to change.
No lambos. No overnight success. Just real, consistent progress, one trading day at a time.
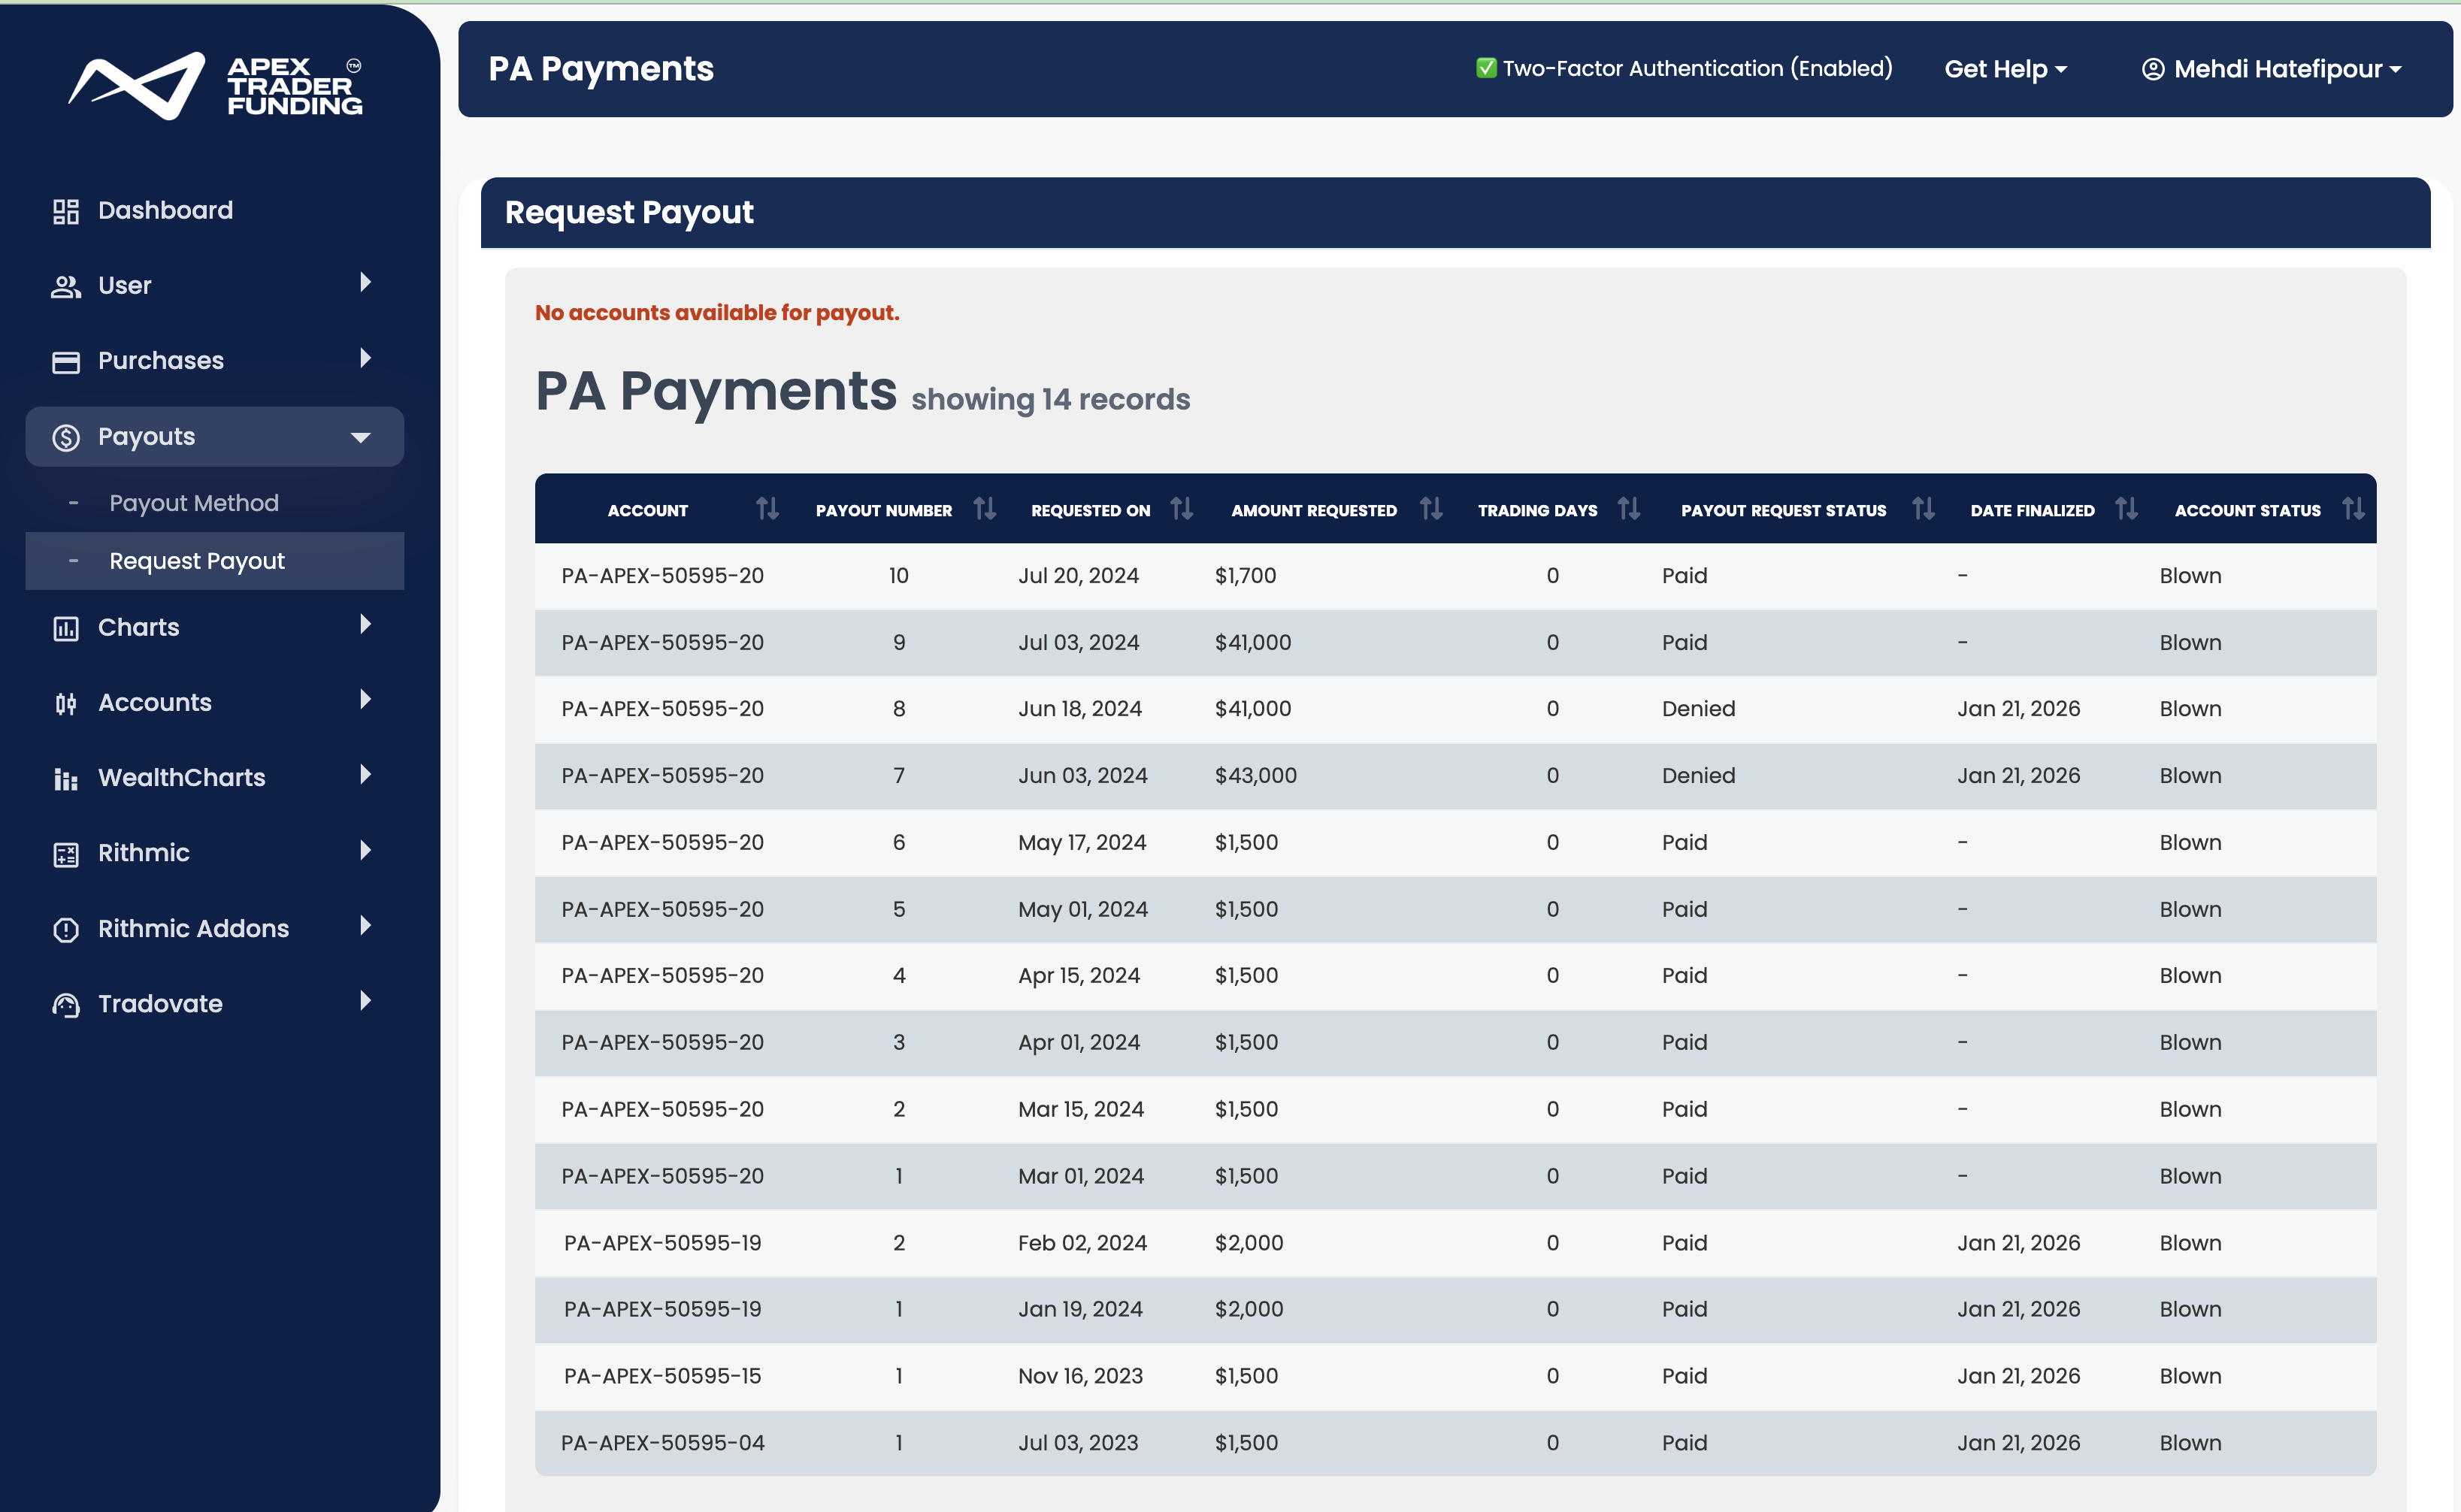
The Proof
Real results from real prop firm accounts. Every certificate here is verified.
Total Verified Payouts
Across 4 prop firms since 2024


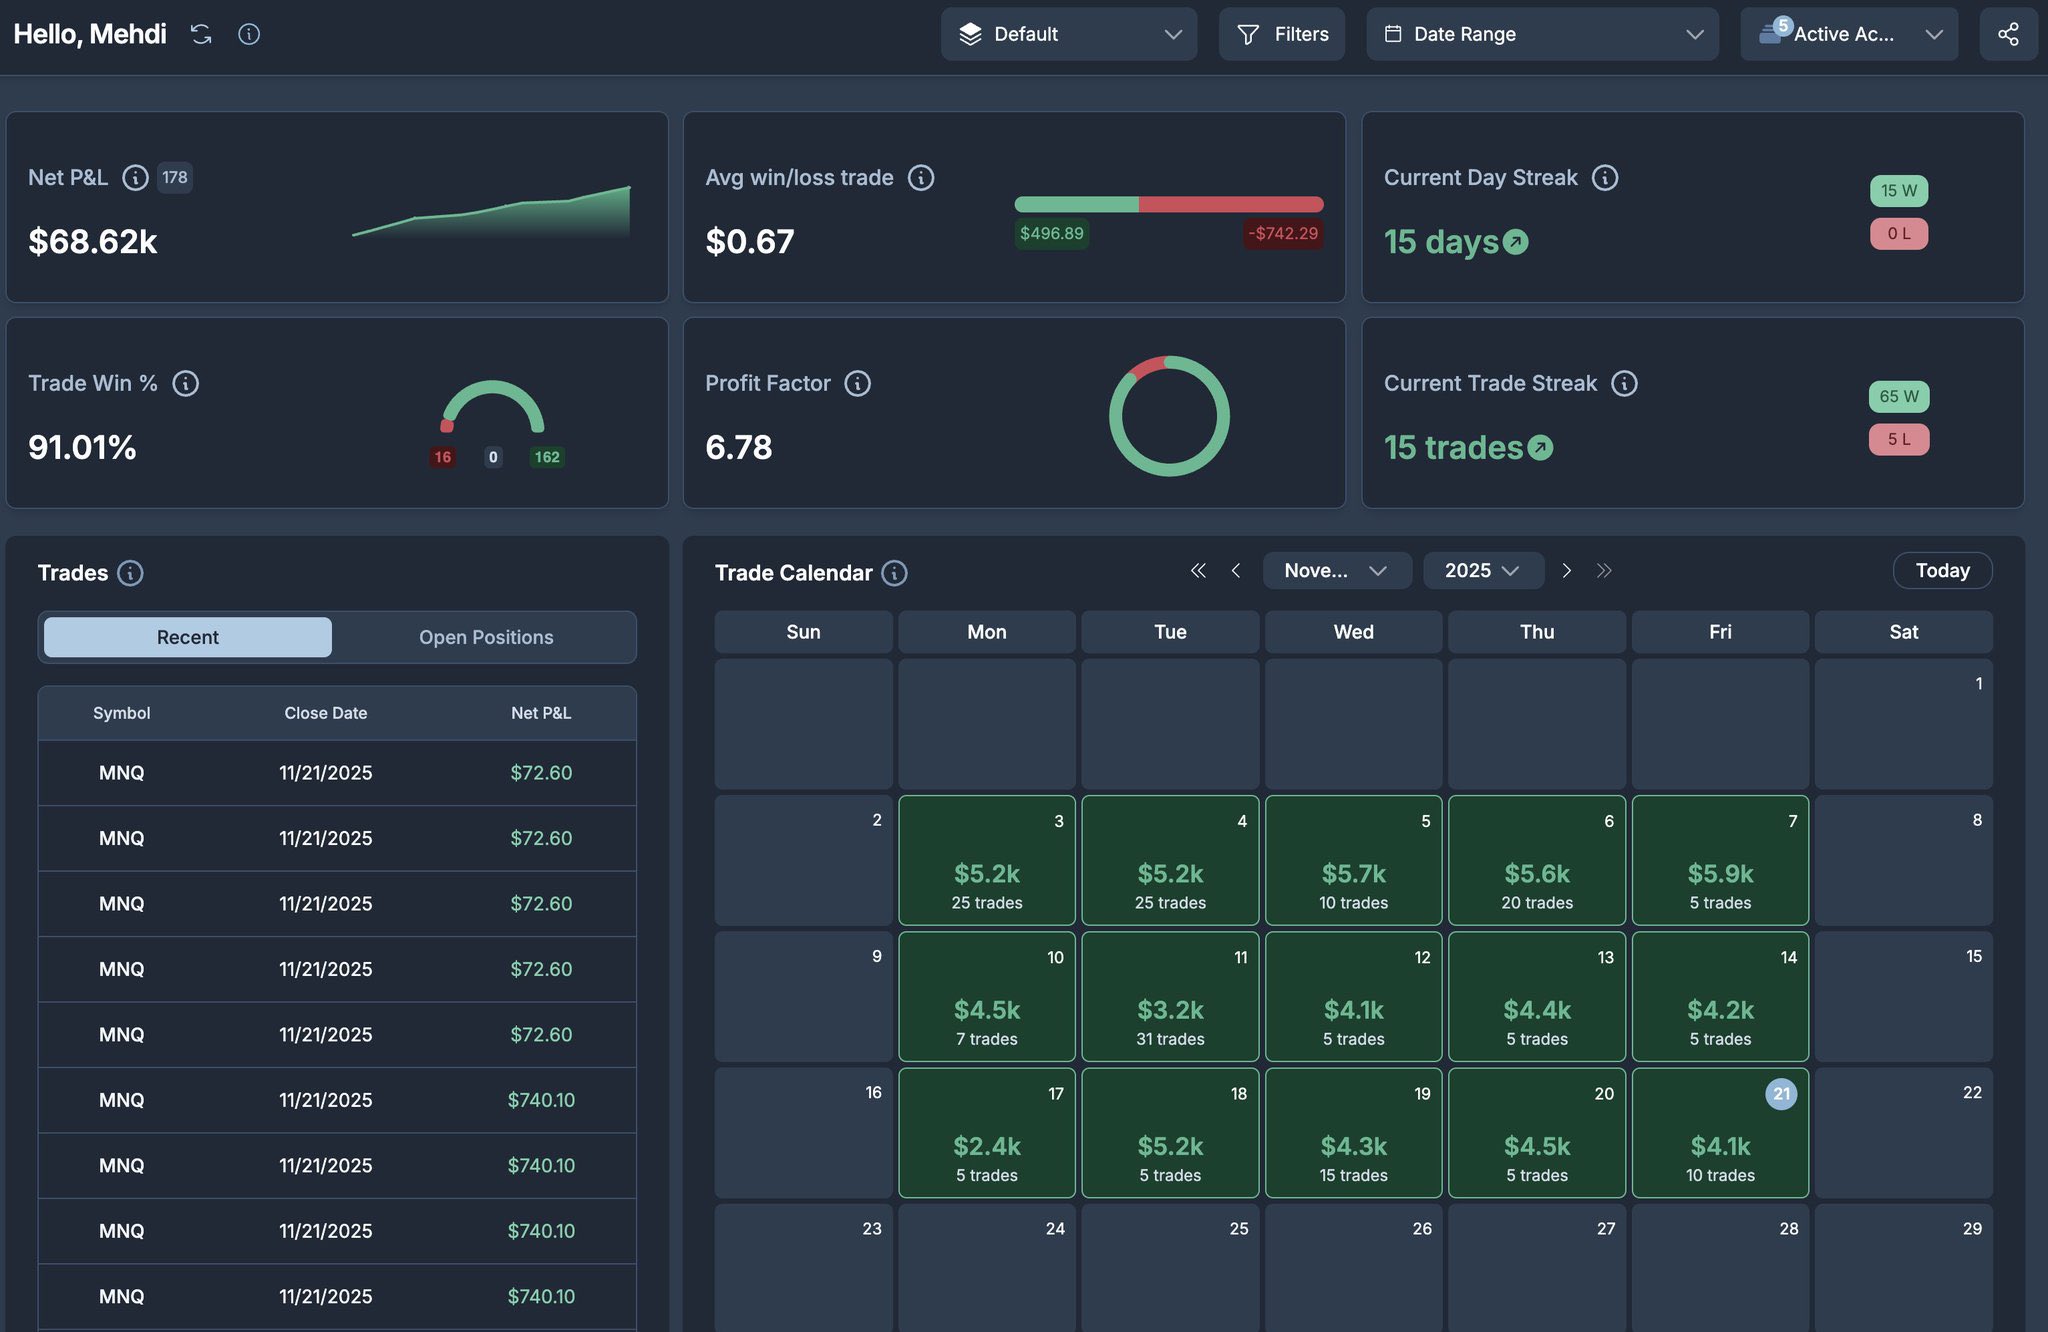
15-day win streak. 91% win rate. $68k net P&L in a single month. Every day on that calendar is green.
But behind this screenshot are years of red days, blown accounts, and lessons that cost real money. Five years of showing up, journaling every trade, and slowly getting better.
Months like this are the result, not the starting point.
November 2025
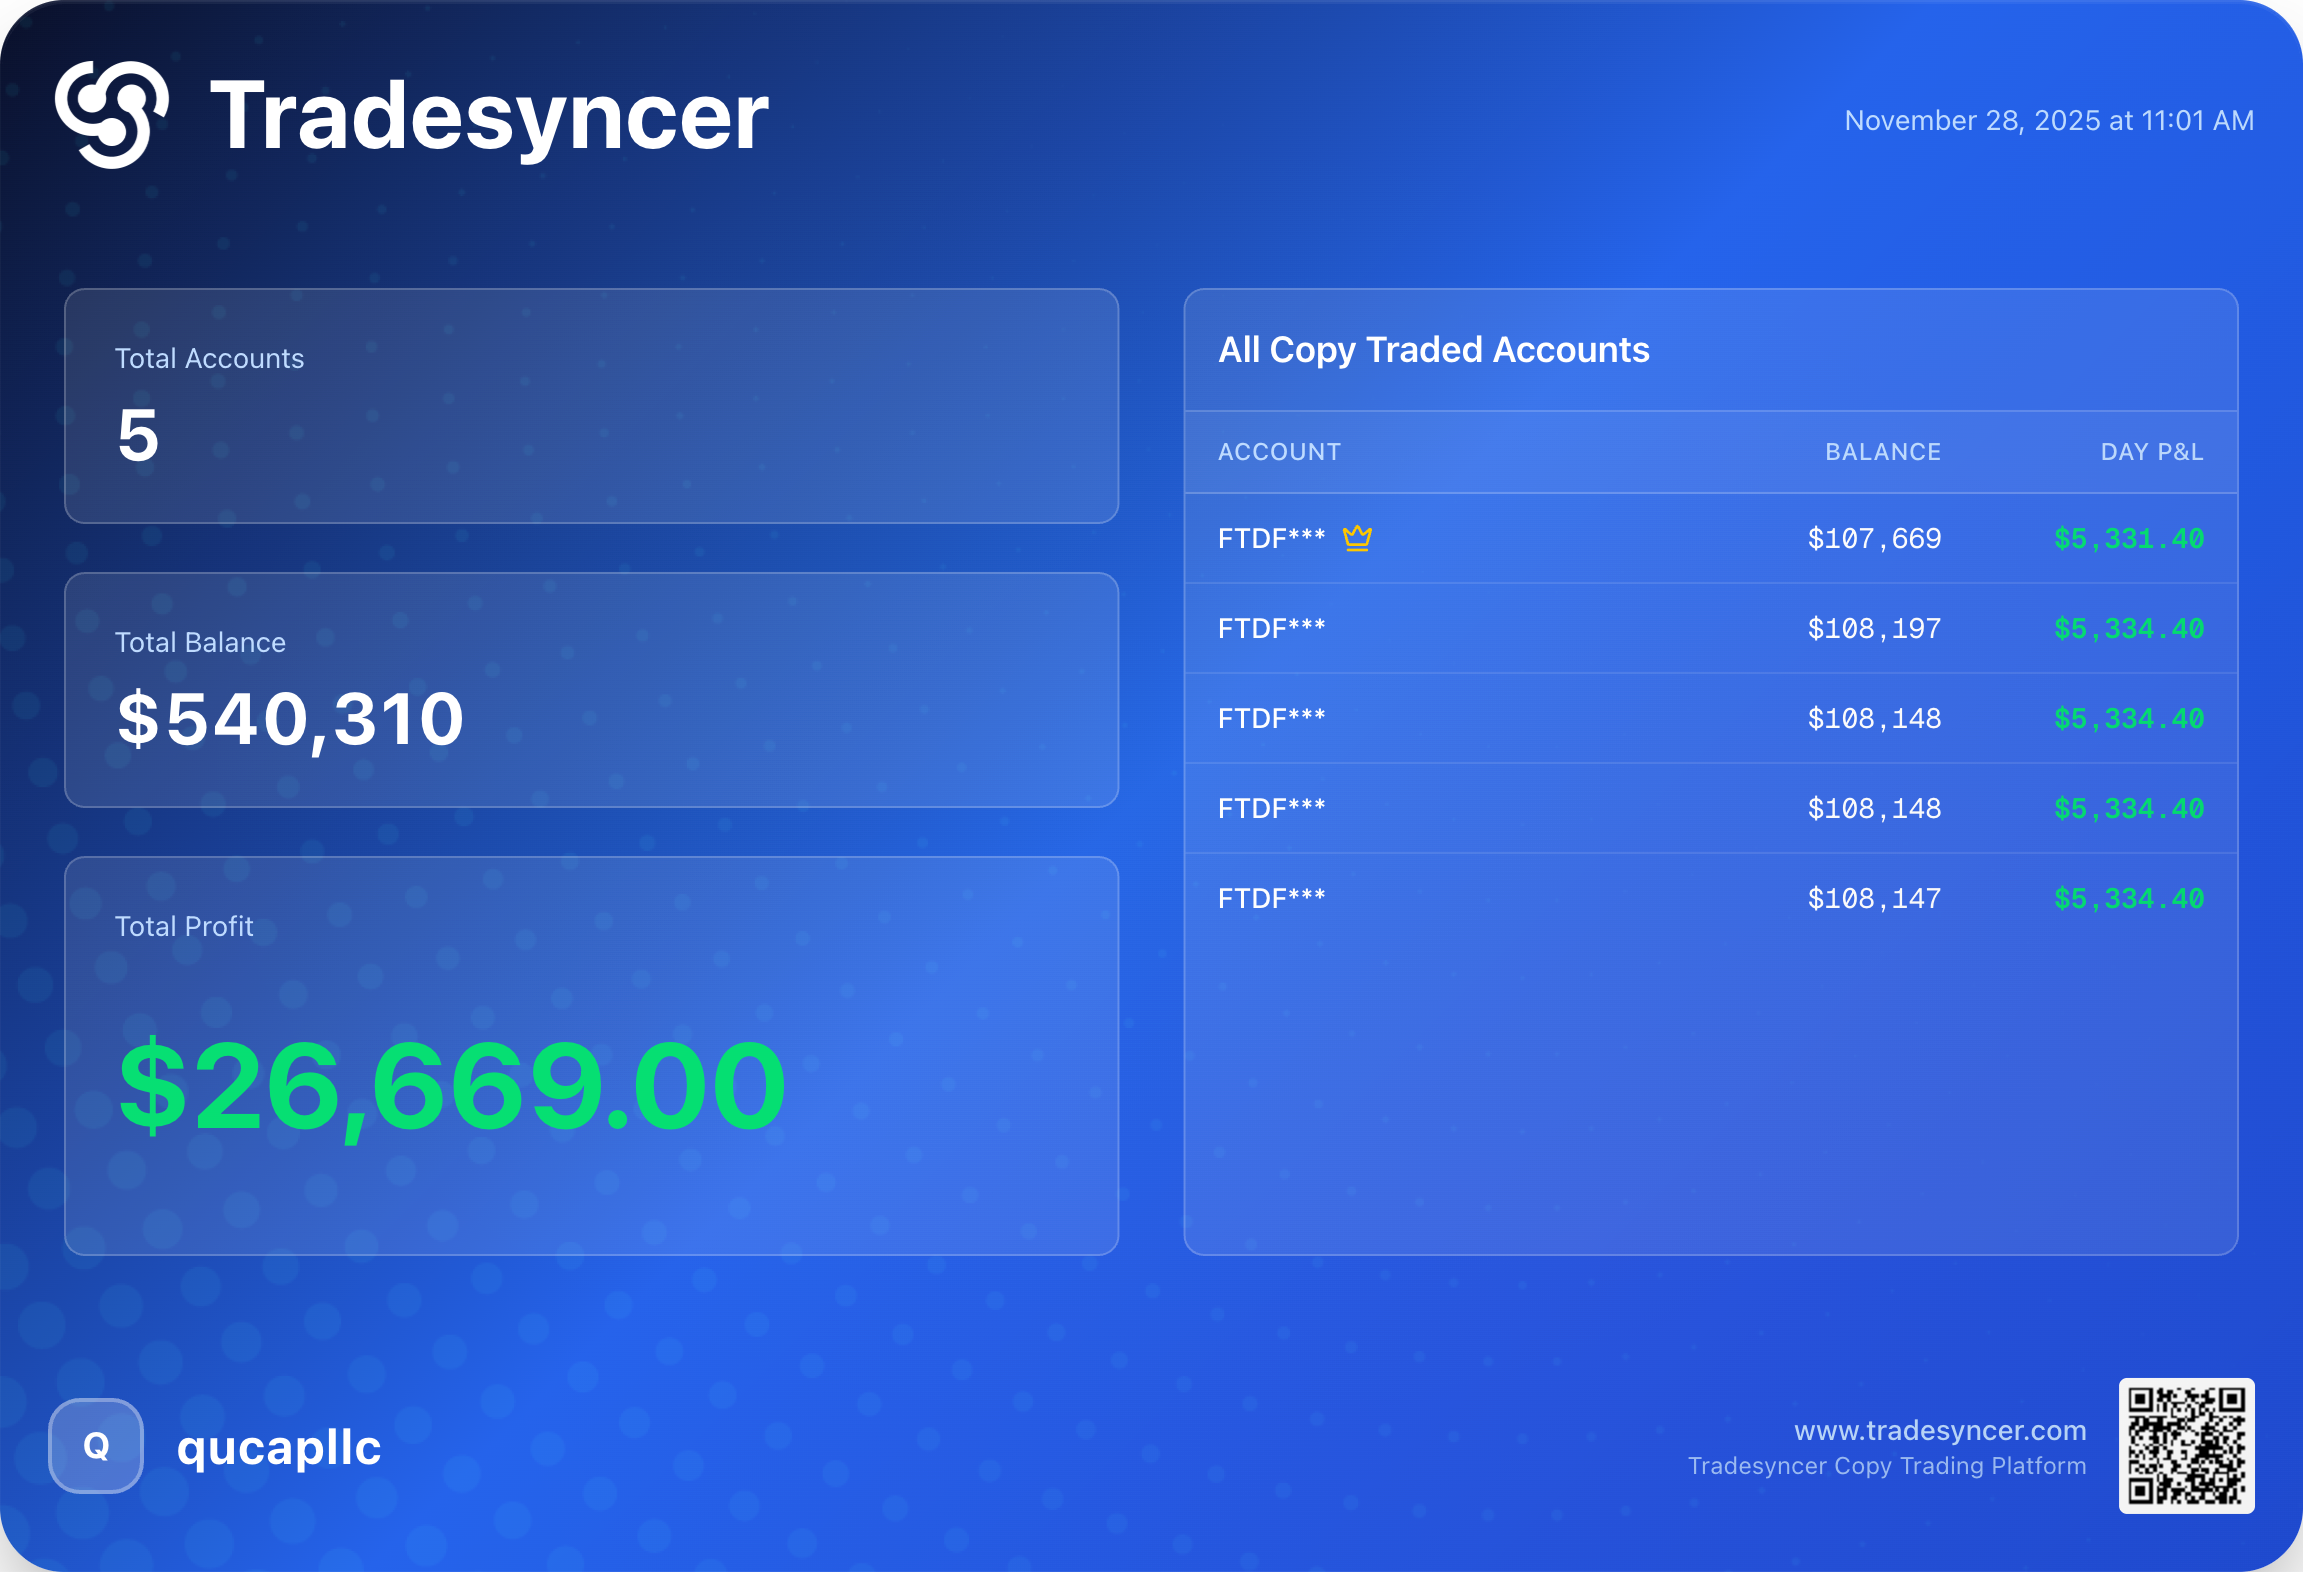
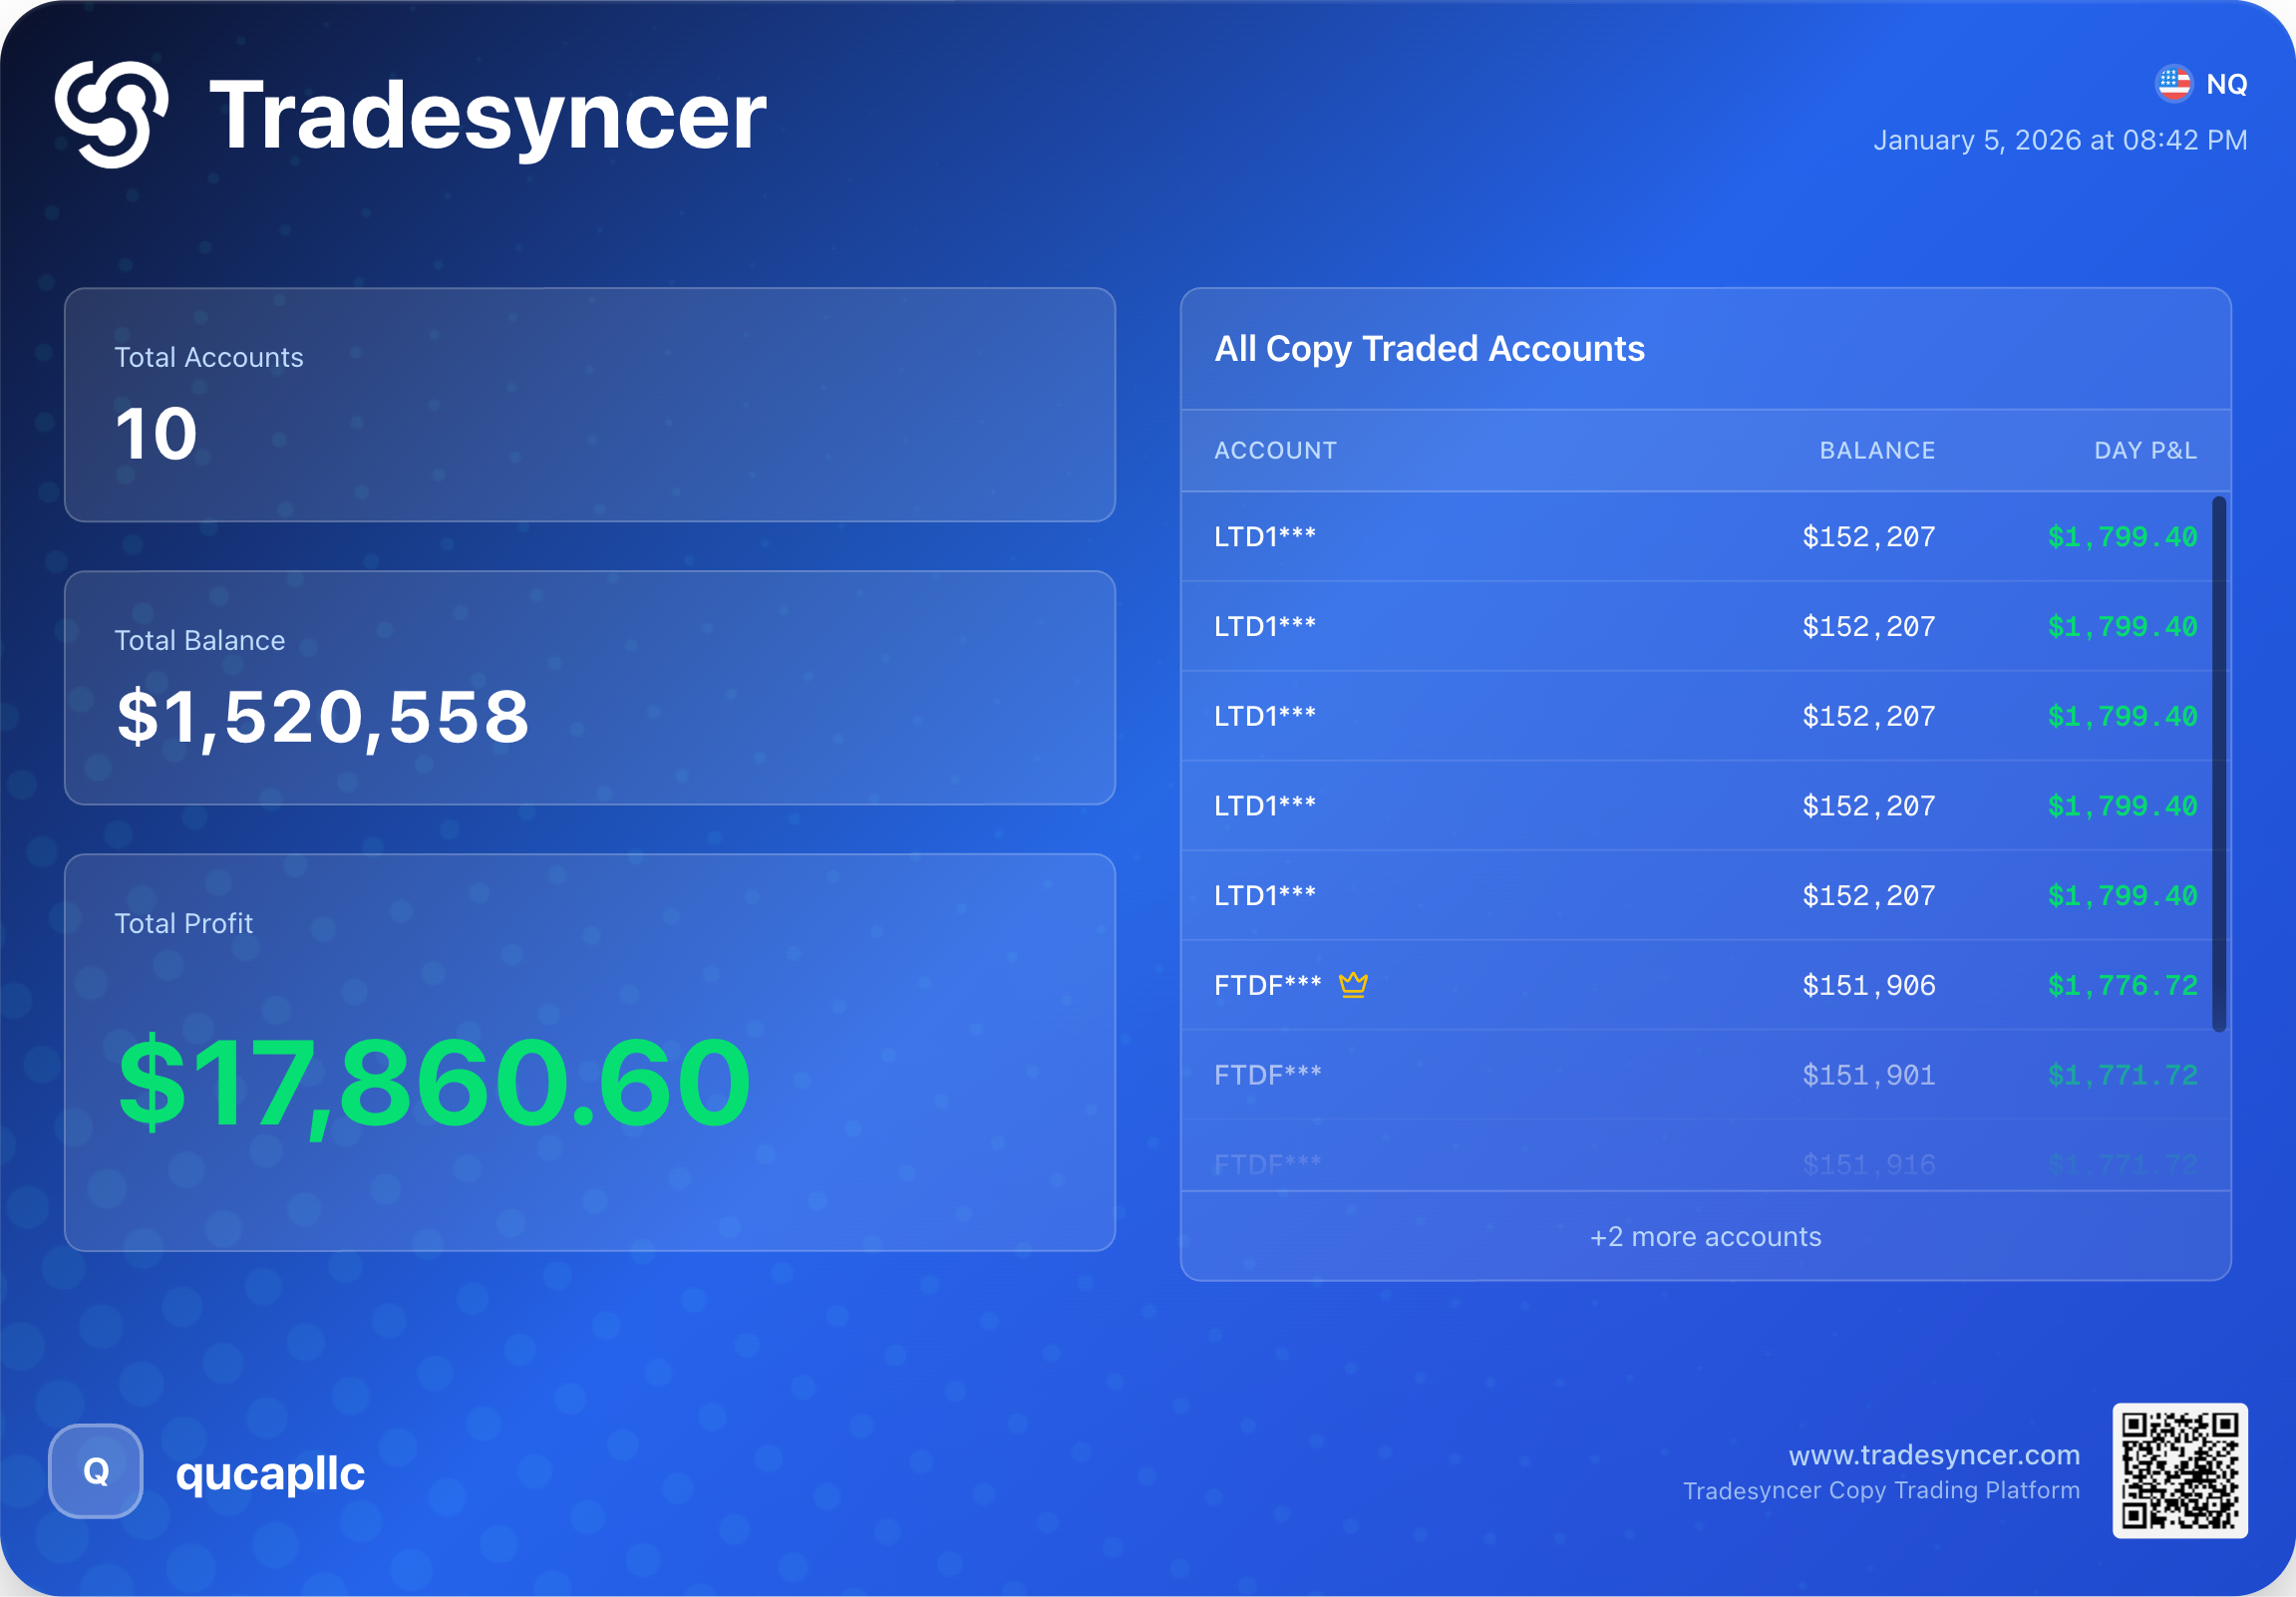
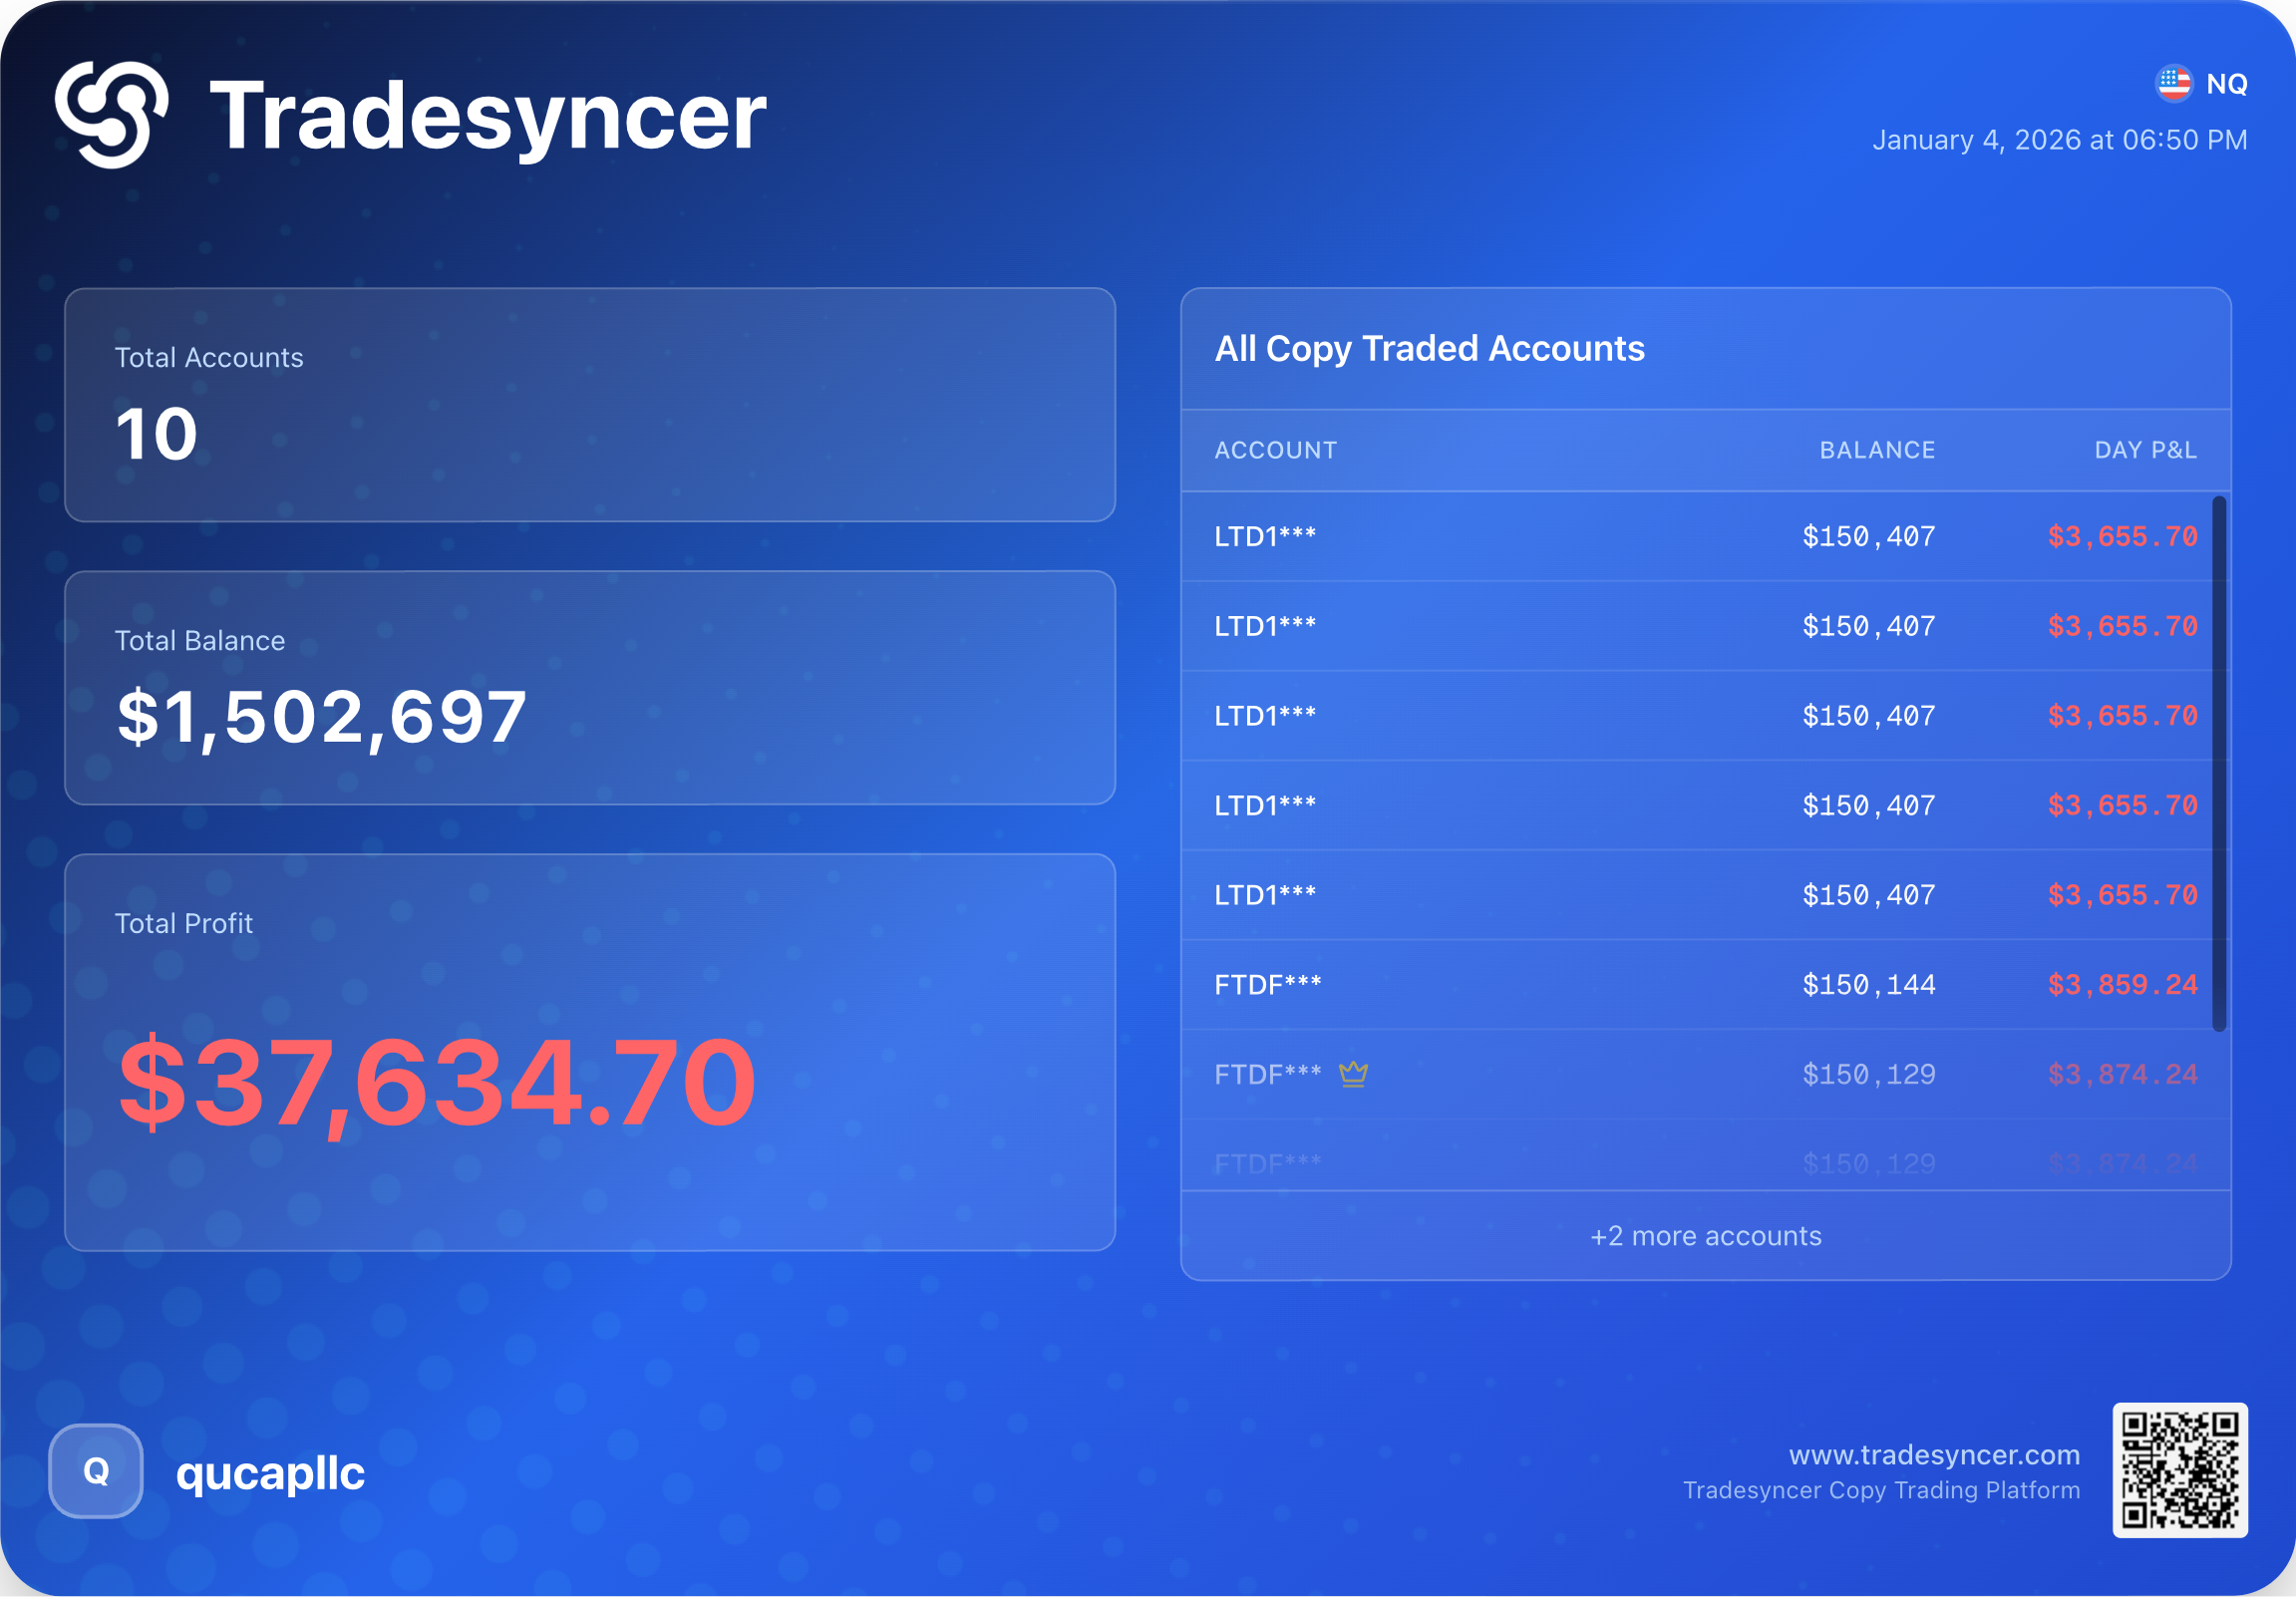
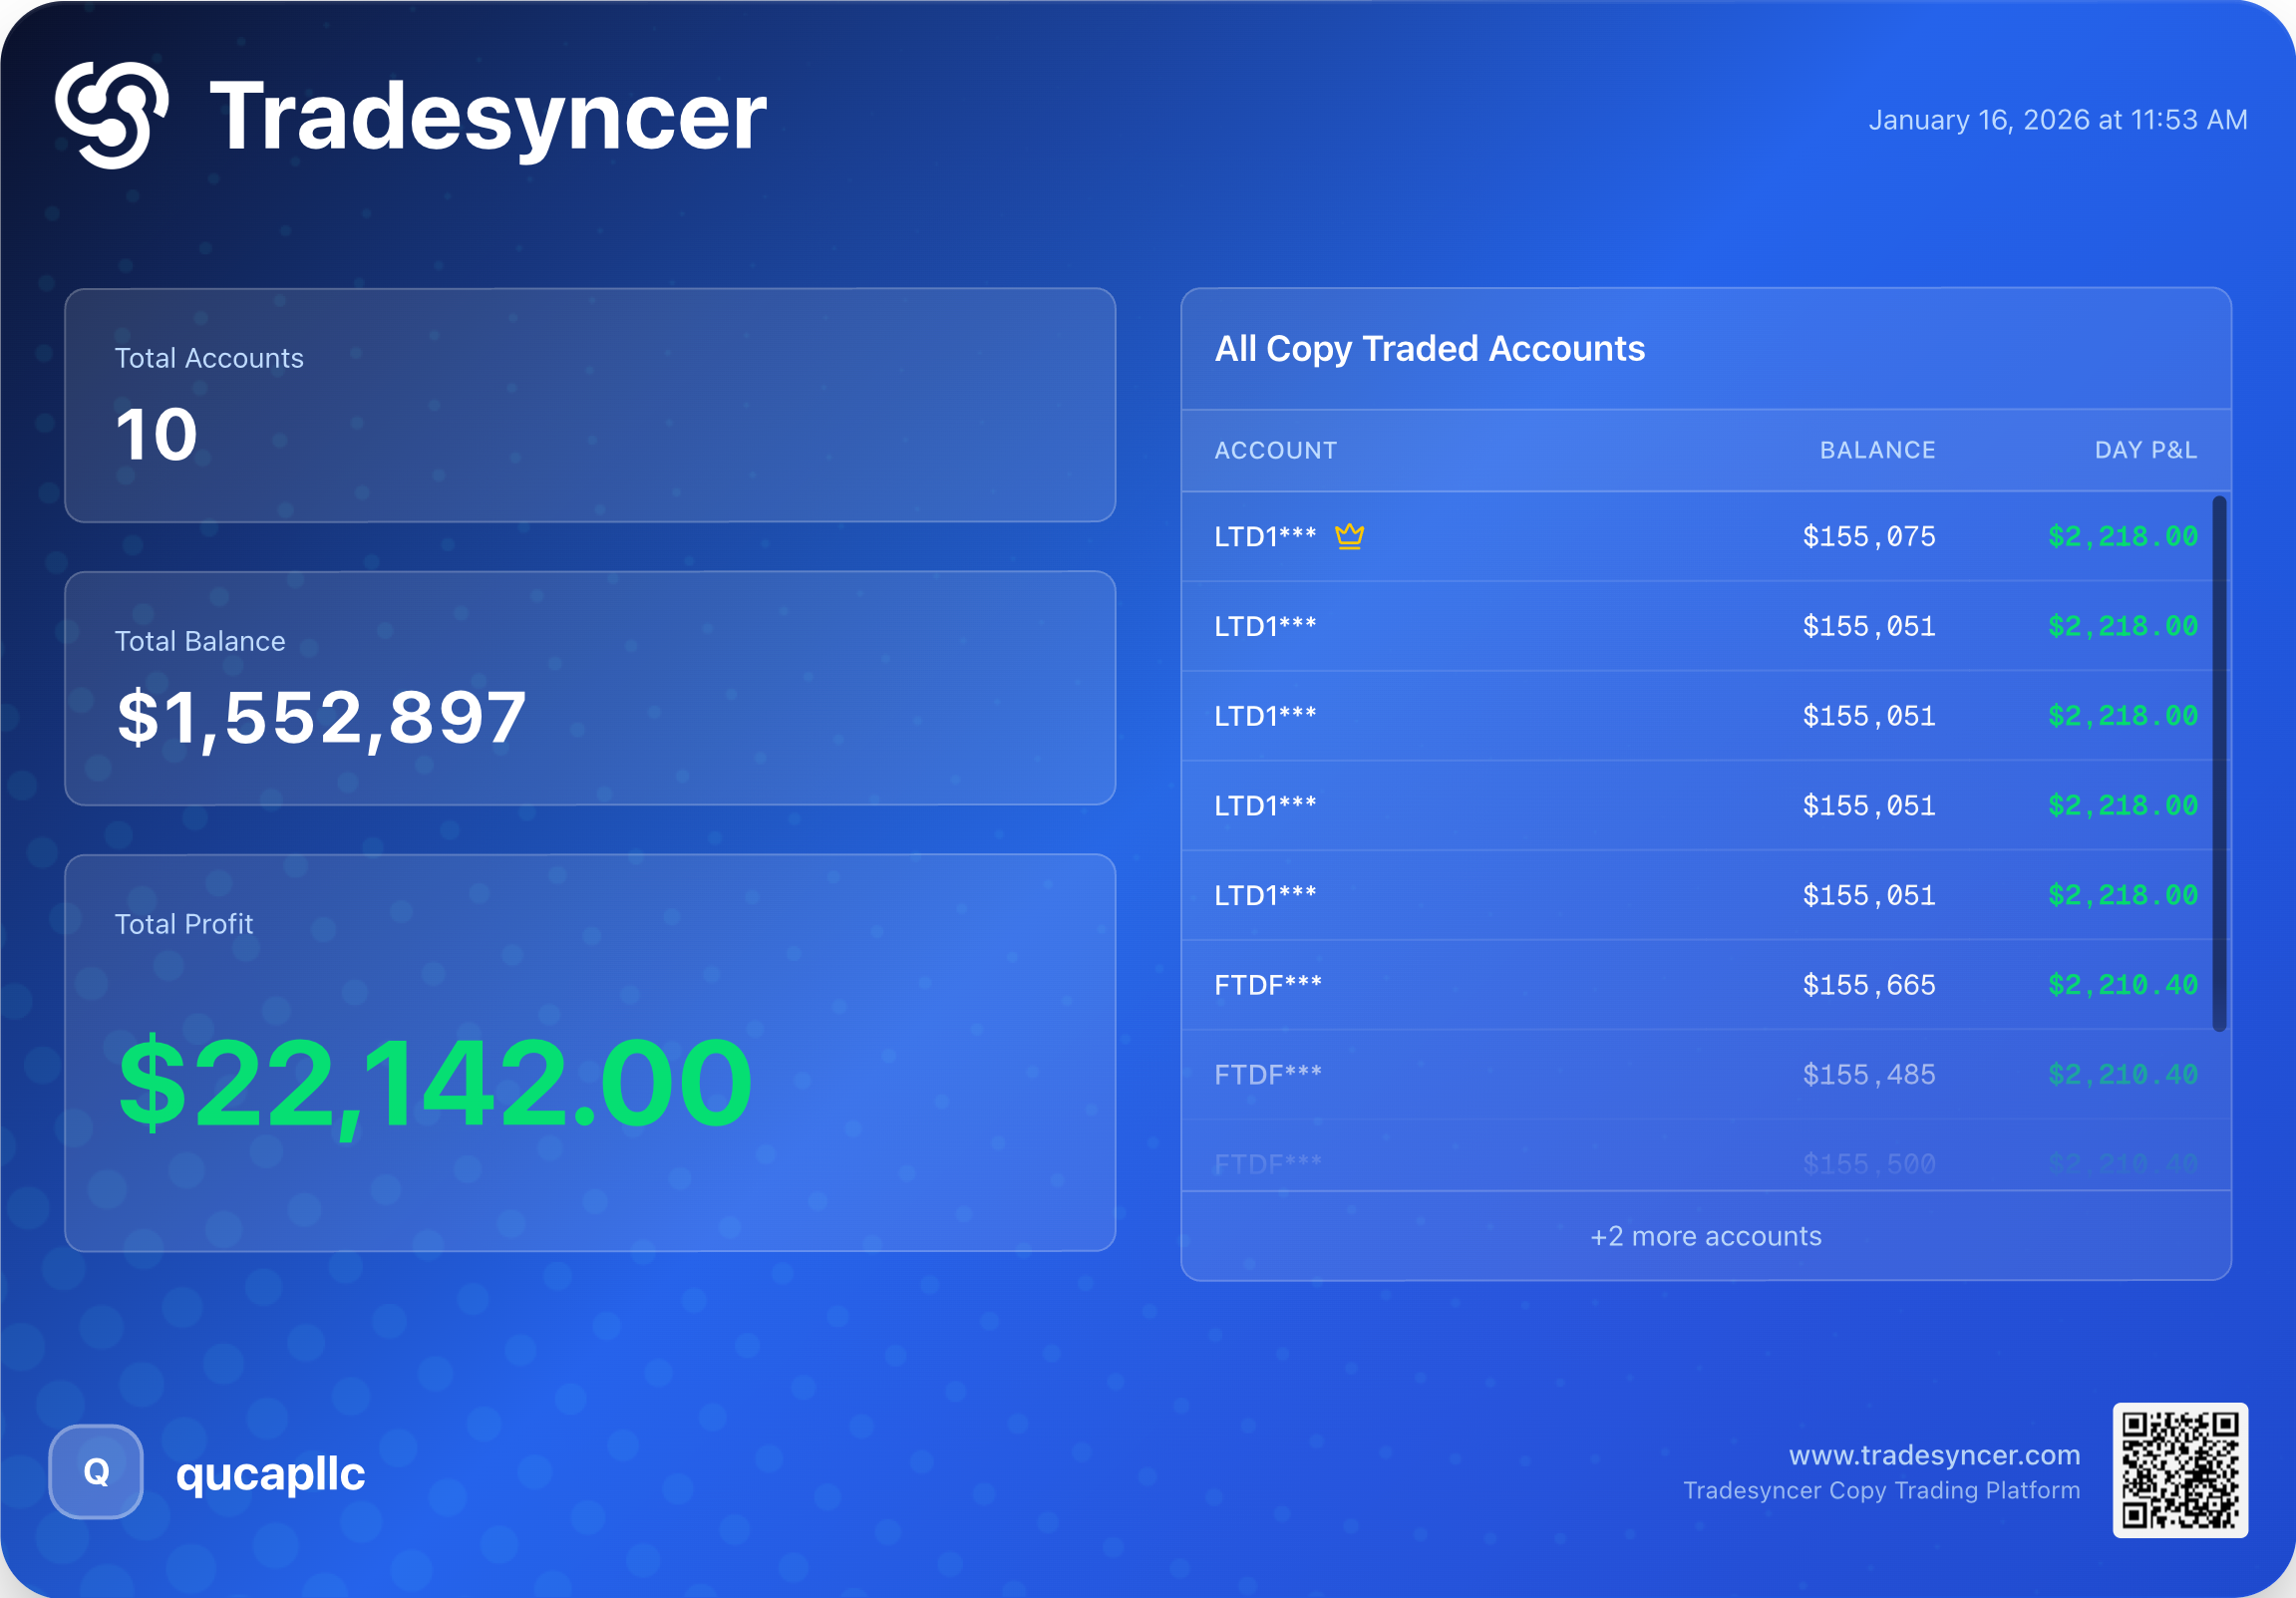
Daily Performance
Snapshots from Tradesyncer. Green days and red days. This is what it actually looks like.
.png)
Free Tools
Open-source TradingView scripts built for precision execution and systemic trading.
Pure Liquidity identifies untouched pivot-based liquidity levels and keeps them on your chart only as long as they remain truly fresh. Unlike standard liquidity indicators that wait for a candle close, this script invalidates levels the instant a wick touches the price — so what you see is what's actually actionable.
| Group | Key Settings |
|---|---|
| Structure | Pivot strength (left/right bars), max levels per side |
| Appearance | Display mode (Zones/Lines), zone thickness, colors, line style/width, transparency, label size, age fade |
| Sweep Detection | Toggle markers, marker shape (Diamond/Cross/Circle), sweep colors |
| Dashboard | Toggle, position (6 options), text size |
| Alerts | Proximity threshold (%) for approach alerts |
Let's Connect
No courses. No signal groups. Just real trading and an honest look at the markets.